Edit chart
Loading graph
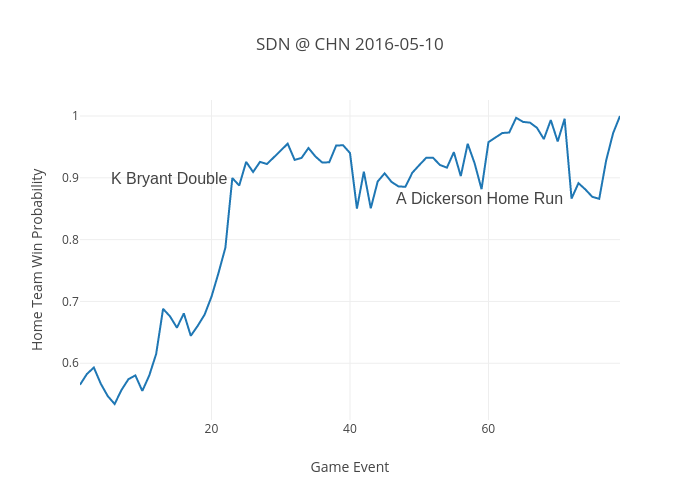
Benfb's interactive graph and data of "SDN @ CHN 2016-05-10" is a line chart; with Game Event in the x-axis and Home Team Win Probability in the y-axis.. The x-axis shows values from 0 to 0. The y-axis shows values from 0 to 0. This visualization has the following annotations: K Bryant Double; A Dickerson Home Run