Edit chart
Loading graph
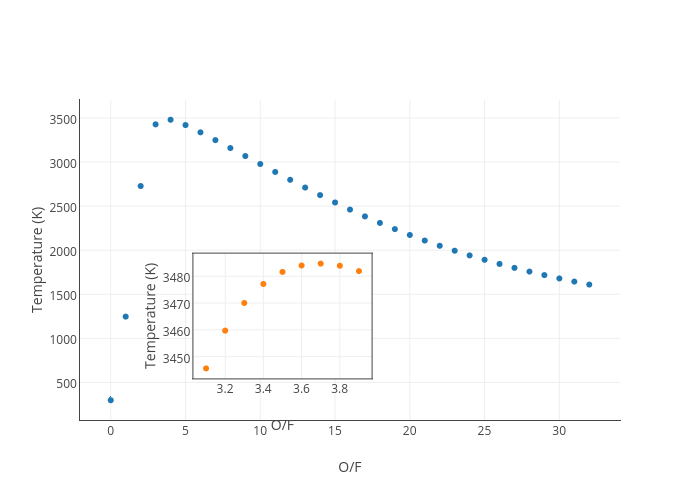
Benjmunro's interactive graph and data of "Temperature (K) vs O/F" is a scatter chart, showing Temperature (K) vs Temperature (K); with O/F in the x-axis and Temperature (K) in the y-axis.. The x-axis shows values from -1.9112846700710928 to 33.91128467007109. The y-axis shows values from 93.46313509544788 to 3683.526864904552.