Edit chart
Loading graph
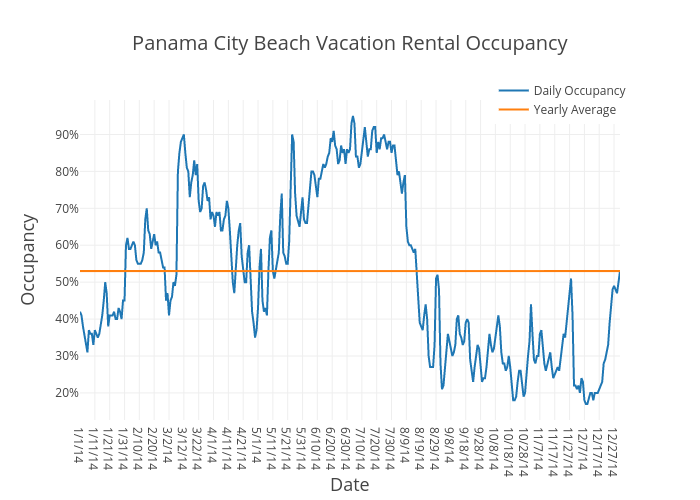
Beyondpricing's interactive graph and data of "Panama City Beach Vacation Rental Occupancy" is a scatter chart, showing Daily Occupancy vs Yearly Average; with Date in the x-axis and Occupancy in the y-axis.. The x-axis shows values from 0 to 364. The y-axis shows values from 12.666666666666666 to 99.33333333333333.