Edit chart
Loading graph
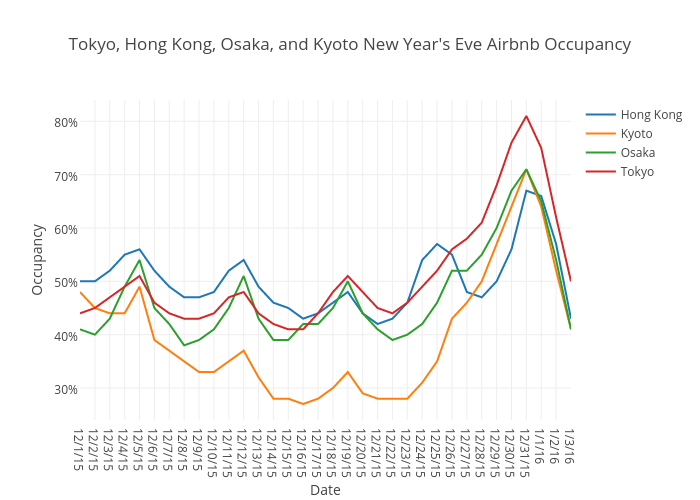
Beyondpricing's interactive graph and data of "Tokyo, Hong Kong, Osaka, and Kyoto New Year's Eve Airbnb Occupancy" is a scatter chart, showing Hong Kong, Kyoto, Osaka, Tokyo; with Date in the x-axis and Occupancy in the y-axis.. The x-axis shows values from 0 to 33. The y-axis shows values from 24 to 84.