Edit chart
Loading graph
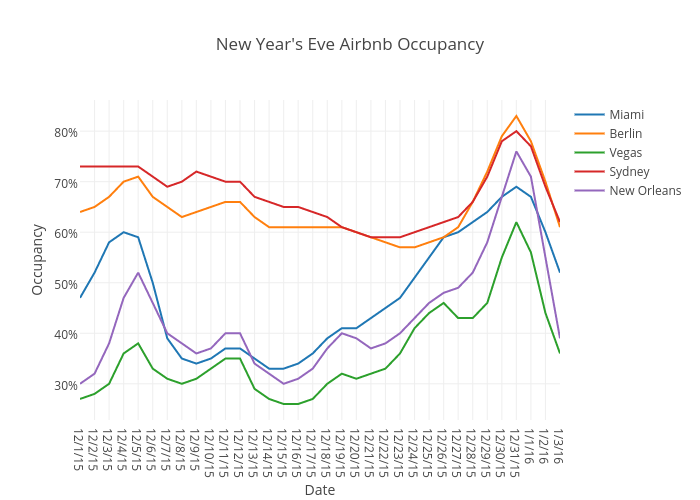
Beyondpricing's interactive graph and data of "New Year's Eve Airbnb Occupancy" is a scatter chart, showing Miami, Berlin, Vegas, Sydney, New Orleans; with Date in the x-axis and Occupancy in the y-axis.. The x-axis shows values from 0 to 33. The y-axis shows values from 22.833333333333332 to 86.16666666666667.