Edit chart
Loading graph
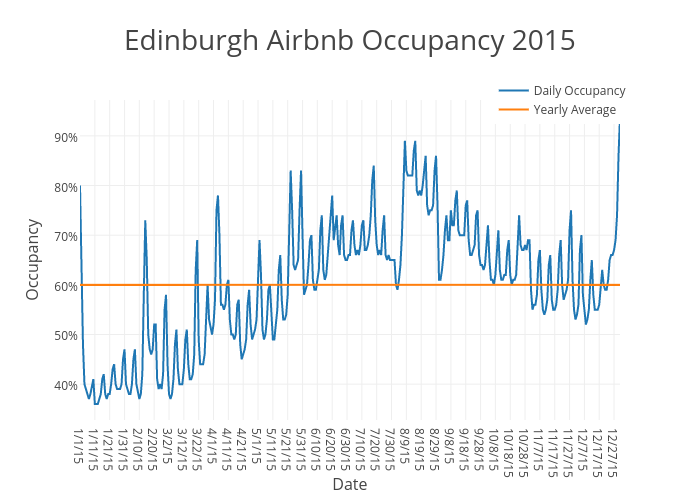
Beyondpricing's interactive graph and data of "Edinburgh Airbnb Occupancy 2015" is a scatter chart, showing Daily Occupancy vs Yearly Average; with Date in the x-axis and Occupancy in the y-axis.. The x-axis shows values from 0 to 364. The y-axis shows values from 32.77777777777778 to 97.22222222222223.