Edit chart
Loading graph
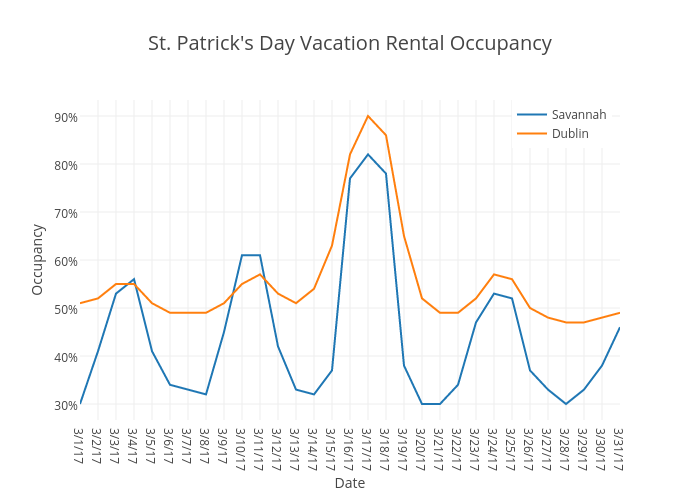
Beyondpricing's interactive graph and data of "St. Patrick's Day Vacation Rental Occupancy" is a line chart, showing Savannah vs Dublin; with Date in the x-axis and Occupancy in the y-axis.. The x-axis shows values from 0 to 30. The y-axis shows values from 26.666666666666668 to 93.33333333333333.