Edit chart
Loading graph
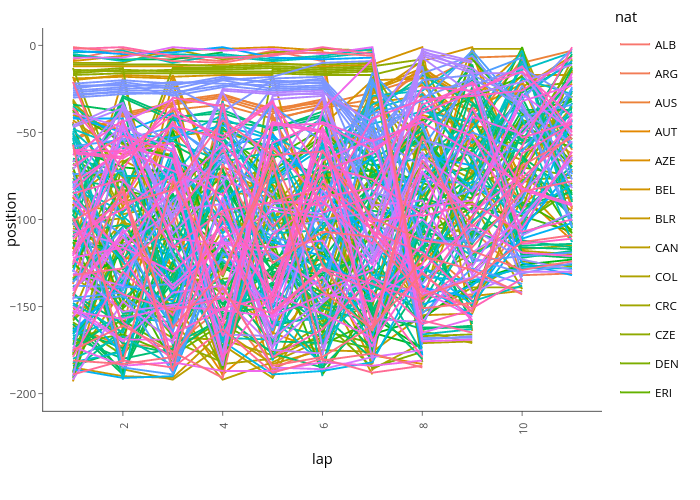
Bfung's interactive graph and data of "position vs lap" is a line chart, showing ALB, ARG, AUS, AUT, AZE, BEL, BLR, CAN, COL, CRC, CZE, DEN, ERI, ESP, EST, FIN, FRA, GBR, GER, GRE, HKG, IRL, ITA, JPN, KAZ, LAT, LTU, LUX, MAR, NED, NOR, NZL, POL, POR, ROU, RSA, RUS, RWA, SLO, SUI, SVK, SWE, UKR, USA; with lap in the x-axis and position in the y-axis.. The x-axis shows values from 0.4 to 11.6. The y-axis shows values from -210 to 10. This visualization has the following annotation: nat