Edit chart
Loading graph
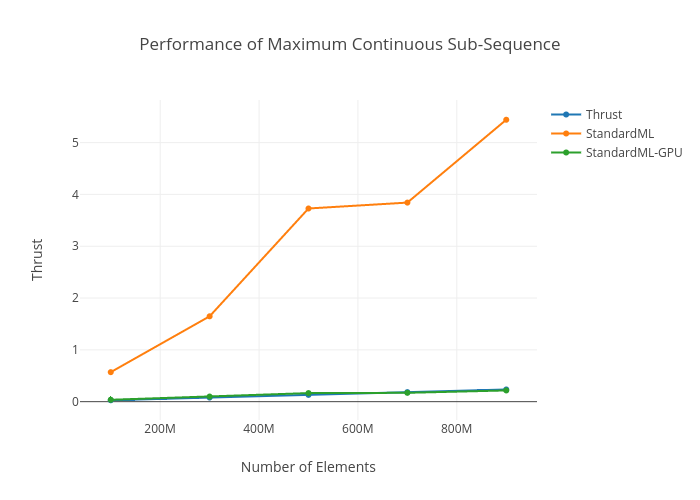
Bhoughton's interactive graph and data of "Performance of Maximum Continuous Sub-Sequence" is a line chart, showing Thrust, StandardML, StandardML-GPU; with Number of Elements in the x-axis and Thrust in the y-axis.. The x-axis shows values from 47462976.4505948 to 952537023.5494052. The y-axis shows values from -0.391974094488189 to 5.860114094488189.