Edit chart
Loading graph
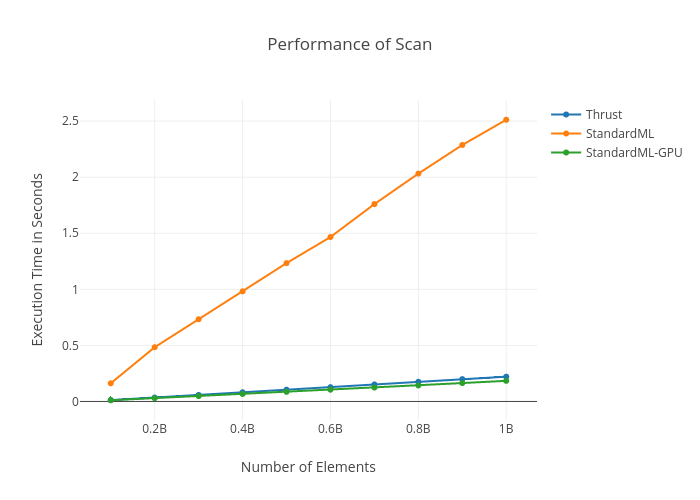
Bhoughton's interactive graph and data of "Performance of Scan" is a line chart, showing Thrust, StandardML, StandardML-GPU; with Number of Elements in the x-axis and Execution Time in Seconds in the y-axis.. The x-axis shows values from 43824110.671936765 to 1056175889.3280632. The y-axis shows values from -0.16265247674826214 to 2.685719143748262.