Edit chart
Loading graph
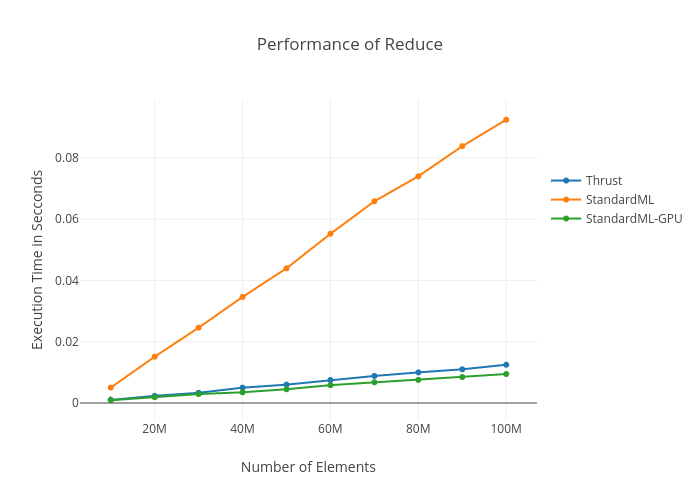
Bhoughton's interactive graph and data of "Performance of Reduce" is a line chart, showing Thrust, StandardML, StandardML-GPU; with Number of Elements in the x-axis and Execution Time in Secconds in the y-axis.. The x-axis shows values from 3620862.587763289 to 106379137.4122367. The y-axis shows values from -0.005452267461105594 to 0.09885226746110559.