Edit chart
Loading graph
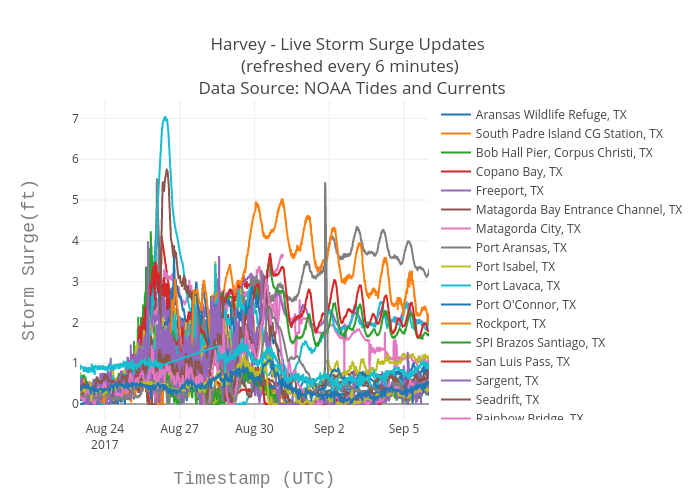
Bigdata153's interactive graph and data of "Harvey - Live Storm Surge Updates (refreshed every 6 minutes) Data Source: NOAA Tides and Currents" is a scatter chart, showing Aransas Wildlife Refuge, TX, South Padre Island CG Station, TX, Bob Hall Pier, Corpus Christi, TX, Copano Bay, TX, Freeport, TX, Matagorda Bay Entrance Channel, TX, Matagorda City, TX, Port Aransas, TX, Port Isabel, TX, Port Lavaca, TX, Port O'Connor, TX, Rockport, TX, SPI Brazos Santiago, TX, San Luis Pass, TX, Sargent, TX, Seadrift, TX, Rainbow Bridge, TX, Port Arthur, TX, Texas Point - Sabine Pass, TX, Sabine Pass North, TX, Rollover Pass, TX, High Island,TX, Bulk Terminal, LA, Lake Charles, LA, Freshwater Canal Locks, LA, Eugene Island, LA, Amerada Pass, LA, Berwick-Atchafalaya River, LA, Grand Isle, LA, Pilots Station East - SW Pass, LA, Pilottown, LA; with Timestamp (UTC) in the x-axis and Storm Surge(ft) in the y-axis.. The x-axis shows values from 0 to 0. The y-axis shows values from 0 to 0.