Edit chart
Loading graph
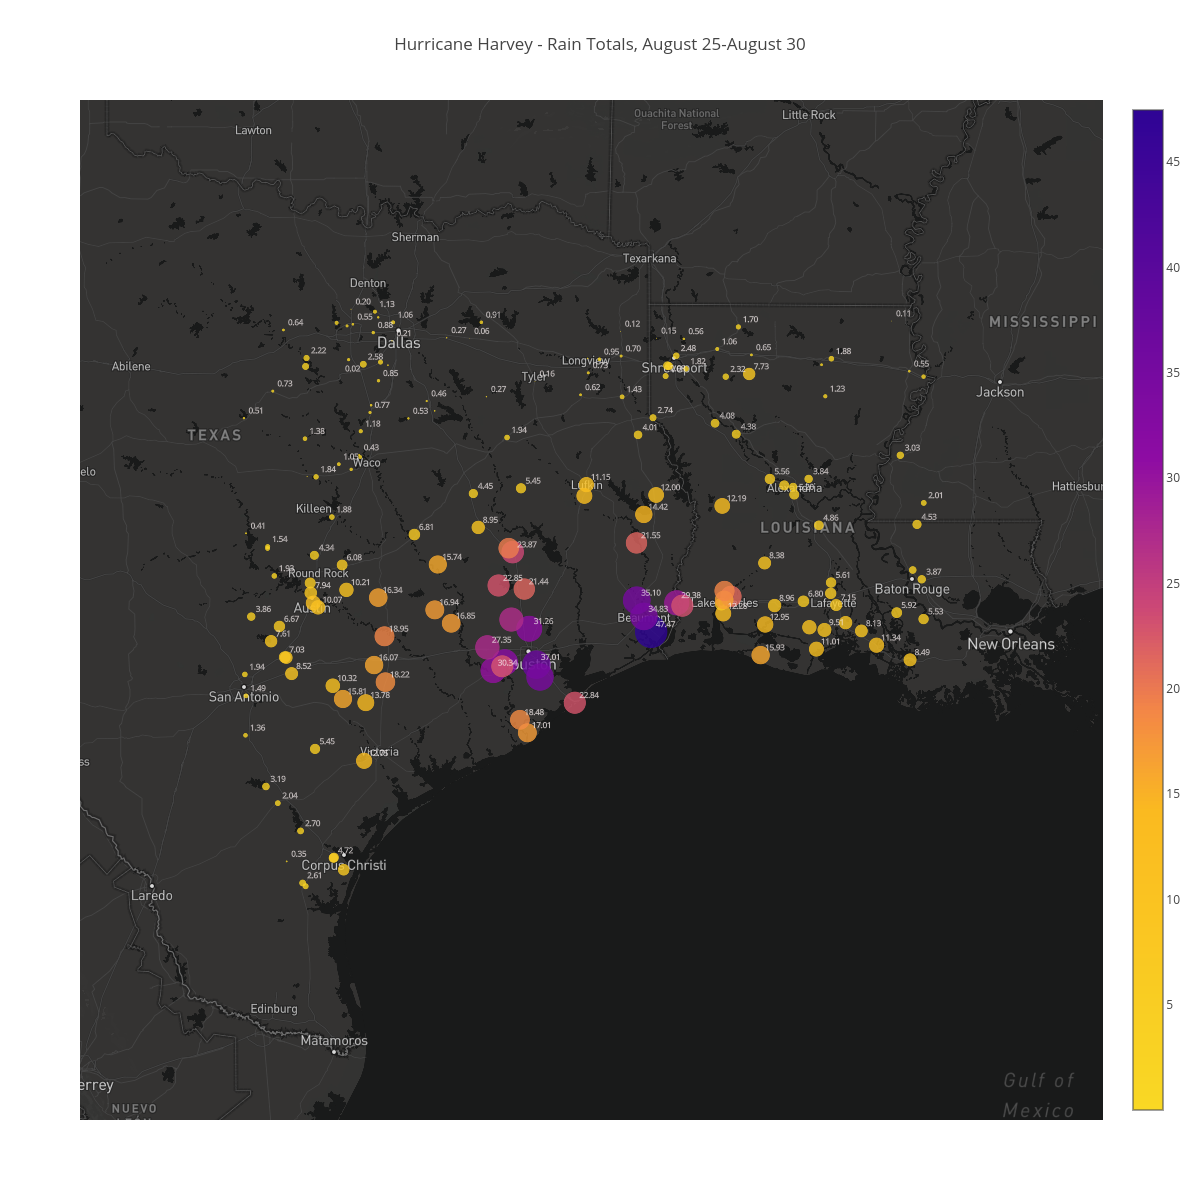
Bigdata153's interactive graph and data of "Hurricane Harvey - Rain Totals, August 25-August 30" is a scattermapbox, showing lon. The x-axis shows values from 0 to 0. The y-axis shows values from 0 to 0.