Edit chart
Loading graph
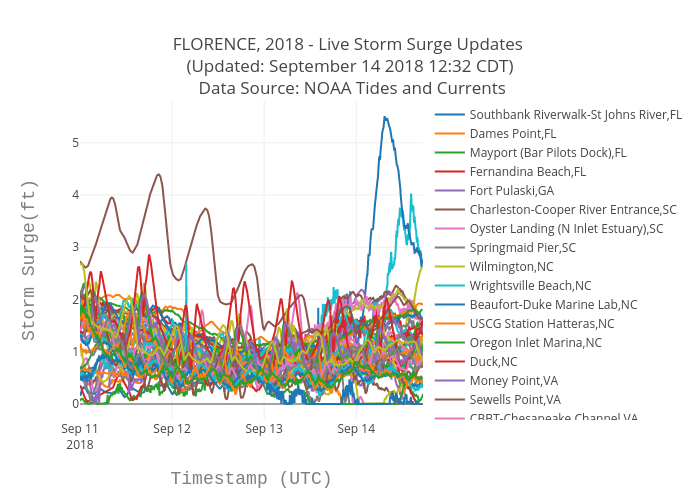
Bigdata153's interactive graph and data of "FLORENCE, 2018 - Live Storm Surge Updates (Updated: September 18 2018 10:32 CDT) Data Source: NOAA Tides and Currents" is a scatter chart, showing Southbank Riverwalk-St Johns River,FL, Dames Point,FL, Mayport (Bar Pilots Dock),FL, Fernandina Beach,FL, Fort Pulaski,GA, Charleston-Cooper River Entrance,SC, Oyster Landing (N Inlet Estuary),SC, Springmaid Pier,SC, Wilmington,NC, Wrightsville Beach,NC, Beaufort-Duke Marine Lab,NC, USCG Station Hatteras,NC, Oregon Inlet Marina,NC, Duck,NC, Money Point,VA, Sewells Point,VA, CBBT-Chesapeake Channel,VA, Kiptopeke,VA, Yorktown USCG Training Center,VA, Wachapreague,VA, Windmill Point,VA, Dahlgren,VA, Lewisetta,VA, Solomons Island,MD, Bishops Head,MD, Annapolis,MD, Tolchester Beach,MD, Ocean City Inlet,MD, Fort McHenry-Patapsco River,MD, Chesapeake City,MD, Cambridge,MD, Brandywine Shoal Light,DE, Reedy Point,DE, Delaware City,DE, Lewes,DE, Washington,DC, Cape May,NJ, Ship John Shoal,NJ, Burlington-Delaware River,NJ, Sandy Hook,NJ, Atlantic City,Nj, Marcus Hook,PA, Philadelphia,PA, Newbold,PA, Bridesburg,PA, Kings Point,NY, The Battery,NY, Bergen Point West Reach,NY, Turkey Point Hudson River NERRS,NY, Montauk,NY, New London-Thames River,CT, New Haven,CT, Bridgeport,CT; with Timestamp (UTC) in the x-axis and Storm Surge(ft) in the y-axis.. The x-axis shows values from 0 to 0. The y-axis shows values from 0 to 0.