Edit chart
Loading graph
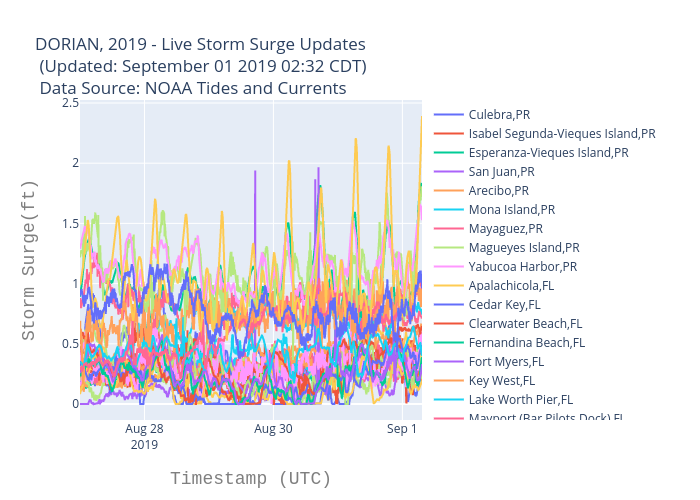
Bigdata153's interactive graph and data of "DORIAN, 2019 - Live Storm Surge Updates (Updated: September 06 2019 07:32 CDT) Data Source: NOAA Tides and Currents" is a scatter chart, showing Culebra,PR, Isabel Segunda-Vieques Island,PR, Esperanza-Vieques Island,PR, San Juan,PR, Arecibo,PR, Mona Island,PR, Mayaguez,PR, Magueyes Island,PR, Yabucoa Harbor,PR, Apalachicola,FL, Cedar Key,FL, Clearwater Beach,FL, Fernandina Beach,FL, Fort Myers,FL, Key West,FL, Lake Worth Pier,FL, Mayport (Bar Pilots Dock),FL, Mckay Bay Entrance,FL, Naples,FL, Old Port Tampa,FL, Panama City,FL, Pensacola,FL, Port Manatee,FL, St Petersburg-Tampa Bay,FL, Trident Pier,FL, Vaca Key,FL, Virginia Key,FL, Fort Pulaski,GA, Charleston - Cooper River Entrance,SC, Oyster Landing (N Inlet Estuary),SC, Springmaid Pier,SC, Wilmington,NC, Wrightsville Beach,NC, Beaufort-Duke Marine Lab,NC, USCG Station Hatteras,NC, Oregon Inlet Marina,NC, Duck,NC, Money Point,VA, Sewells Point,VA, CBBT-Chesapeake Channel,VA, Kiptopeke,VA, Yorktown USCG Training Center,VA, Wachapreague,VA, Windmill Point,VA, Dahlgren,VA, Lewisetta,VA, Solomons Island,MD, Bishops Head,MD, Annapolis,MD, Tolchester Beach,MD, Ocean City Inlet,MD, Fort McHenry-Patapsco River,MD, Chesapeake City,MD, Cambridge,MD, Brandywine Shoal Light,DE, Reedy Point,DE, Delaware City,DE, Lewes,DE, Washington,DC; with Timestamp (UTC) in the x-axis and Storm Surge(ft) in the y-axis.. The x-axis shows values from 0 to 0. The y-axis shows values from 0 to 0.