Edit chart
Loading graph
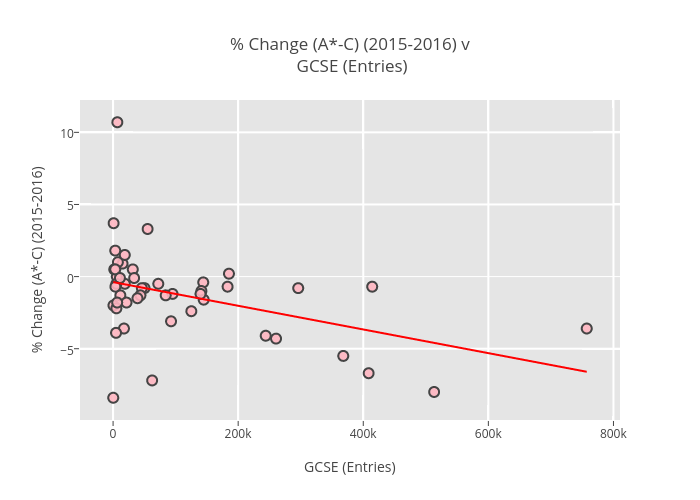
Billatnapier's interactive graph and data of "% Change (A*-C) (2015-2016) v GCSE (Entries)" is a scatter chart, showing Grad:-8.21049191661e-06; with GCSE (Entries) in the x-axis and % Change (A*-C) (2015-2016) in the y-axis.. The x-axis shows values from 0 to 0. The y-axis shows values from 0 to 0.