Edit chart
Loading graph
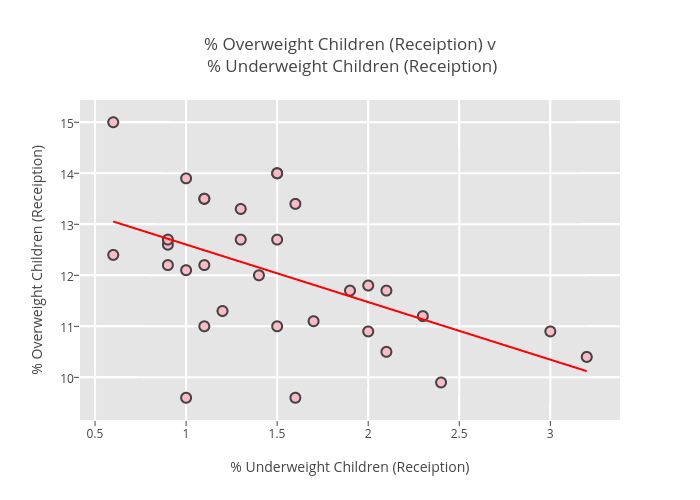
Billatnapier's interactive graph and data of "% Overweight Children (Receiption) v % Underweight Children (Receiption)" is a scatter chart, showing Grad:-1.12810085401; with % Underweight Children (Receiption) in the x-axis and % Overweight Children (Receiption) in the y-axis.. The x-axis shows values from 0 to 0. The y-axis shows values from 0 to 0.