Edit chart
Loading graph
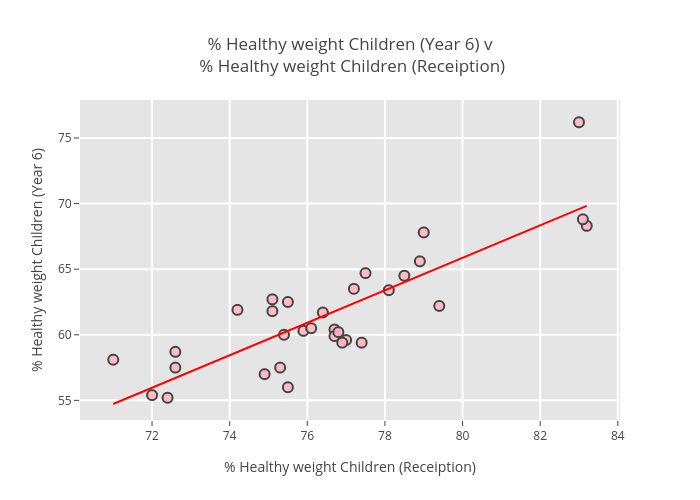
Billatnapier's interactive graph and data of "% Healthy weight Children (Year 6) v % Healthy weight Children (Receiption)" is a scatter chart, showing Grad:1.23756603662; with % Healthy weight Children (Receiption) in the x-axis and % Healthy weight Children (Year 6) in the y-axis.. The x-axis shows values from 0 to 0. The y-axis shows values from 0 to 0.