Edit chart
Loading graph
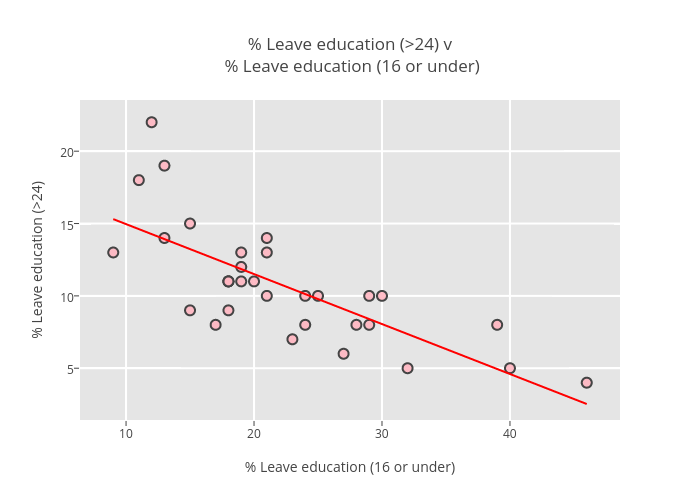
Billatnapier's interactive graph and data of "% Leave education (>24) v % Leave education (16 or under)" is a scatter chart, showing Grad:-0.345350811655; with % Leave education (16 or under) in the x-axis and % Leave education (>24) in the y-axis.. The x-axis shows values from 0 to 0. The y-axis shows values from 0 to 0.