Edit chart
Loading graph
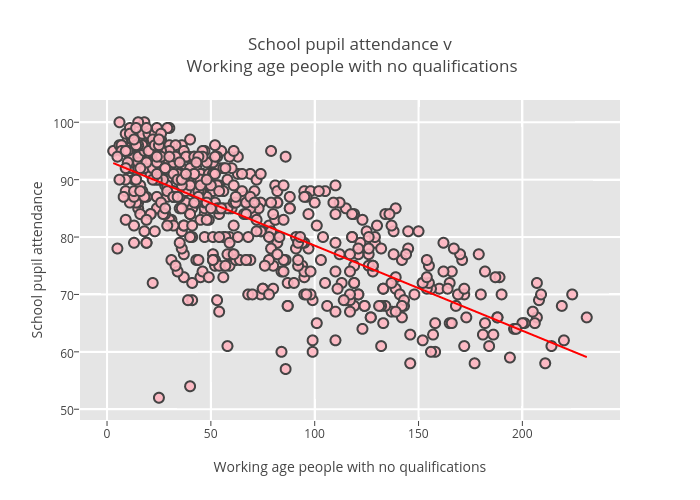
Billatnapier's interactive graph and data of "School pupil attendance v Working age people with no qualifications" is a scatter chart, showing Grad:-0.148253286743; with Working age people with no qualifications in the x-axis and School pupil attendance in the y-axis.. The x-axis shows values from 0 to 0. The y-axis shows values from 0 to 0.