Edit chart
Loading graph
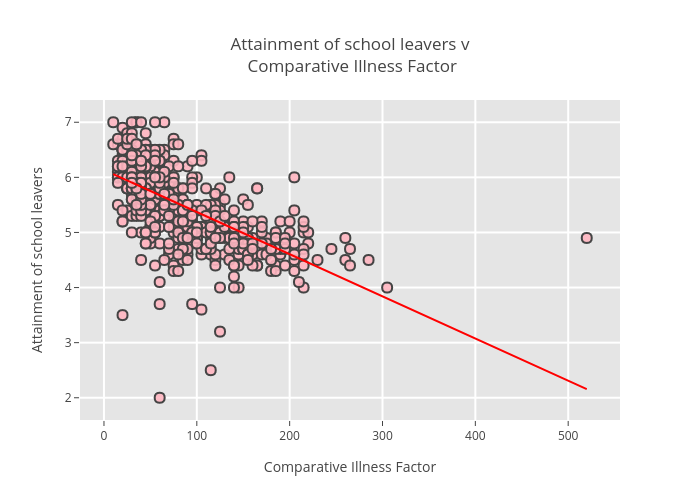
Billatnapier's interactive graph and data of "Attainment of school leavers v Comparative Illness Factor" is a scatter chart, showing Grad:-0.00765394407237; with Comparative Illness Factor in the x-axis and Attainment of school leavers in the y-axis.. The x-axis shows values from 0 to 0. The y-axis shows values from 0 to 0.