Edit chart
Loading graph
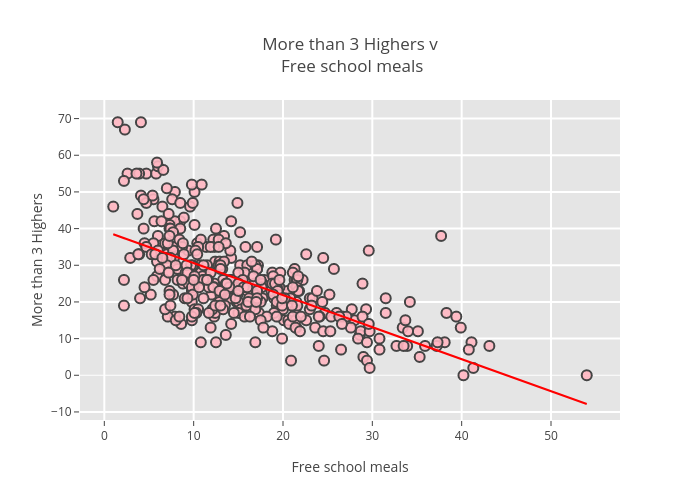
Billatnapier's interactive graph and data of "More than 3 Highers v Free school meals" is a scatter chart, showing Grad:-0.873191016256; with Free school meals in the x-axis and More than 3 Highers in the y-axis.. The x-axis shows values from 0 to 0. The y-axis shows values from 0 to 0.