Edit chart
Loading graph
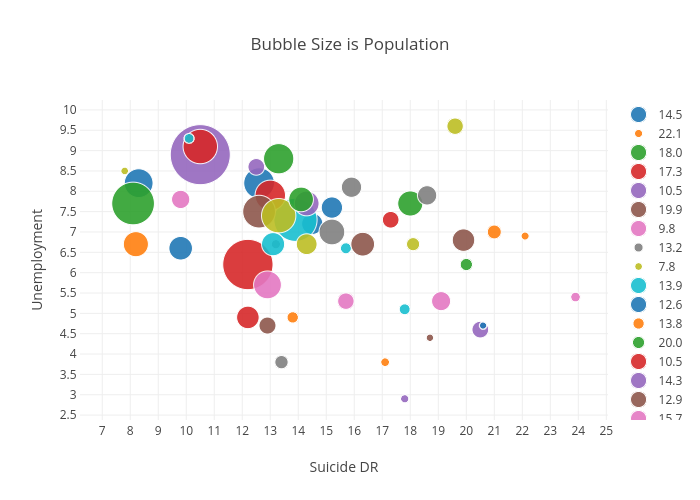
Billatnapier's interactive graph and data of "Bubble Size is Population" is a scatter chart, showing 14.5, 22.1, 18.0, 17.3, 10.5, 19.9, 9.8, 13.2, 7.8, 13.9, 12.6, 13.8, 20.0, 10.5, 14.3, 12.9, 15.7, 15.9, 14.3, 15.7, 9.8, 8.2, 13.3, 12.2, 12.5, 16.3, 23.9, 13.4, 19.6, 17.8, 8.3, 21.0, 8.1, 13.0, 17.8, 12.6, 19.1, 18.6, 13.3, 10.1, 15.2, 17.1, 14.1, 12.2, 20.5, 18.7, 12.9, 15.2, 18.1, 13.1, 20.6; with Suicide DR in the x-axis and Unemployment in the y-axis.. The x-axis shows values from 0 to 0. The y-axis shows values from 0 to 0.