Edit chart
Loading graph
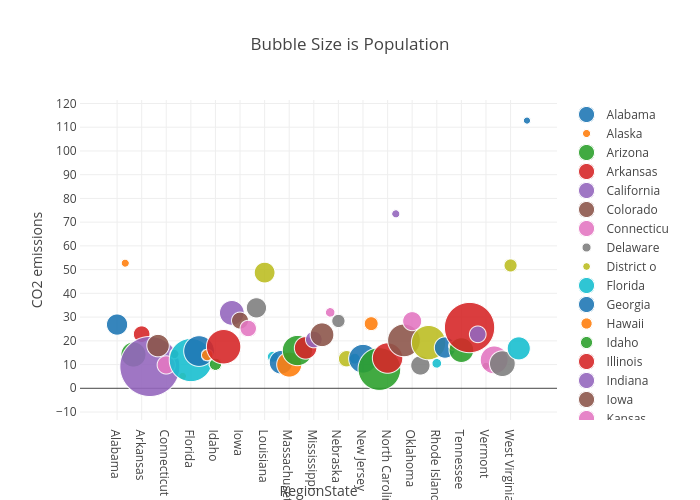
Billatnapier's interactive graph and data of "Bubble Size is Population" is a scatter chart, showing Alabama, Alaska, Arizona, Arkansas, California, Colorado, Connecticu, Delaware, District o, Florida, Georgia, Hawaii, Idaho, Illinois, Indiana, Iowa, Kansas, Kentucky, Louisiana, Maine, Maryland, Massachuse, Michigan, Minnesota, Mississipp, Missouri, Montana, Nebraska, Nevada, New Hampsh, New Jersey, New Mexico, New York, North Caro, North Dako, Ohio, Oklahoma, Oregon, Pennsylvan, Rhode Isla, South Caro, South Dako, Tennessee, Texas, Utah, Vermont, Virginia, Washington, West Virgi, Wisconsin, Wyoming; with RegionState in the x-axis and CO2 emissions in the y-axis.. The x-axis shows values from 0 to 0. The y-axis shows values from 0 to 0.