Edit chart
Loading graph
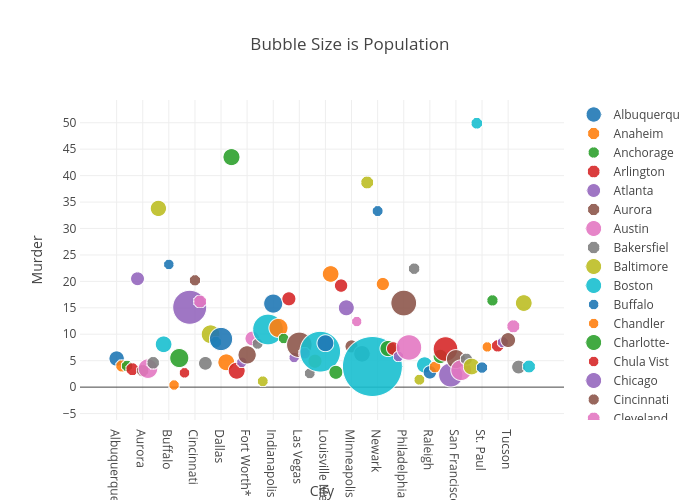
Billatnapier's interactive graph and data of "Bubble Size is Population" is a scatter chart, showing Albuquerqu, Anaheim, Anchorage, Arlington, Atlanta, Aurora, Austin, Bakersfiel, Baltimore, Boston, Buffalo, Chandler, Charlotte-, Chula Vist, Chicago, Cincinnati, Cleveland, Colorado S, Columbus, Corpus Chr, Dallas, Denver, Detroit, El Paso, Fort Wayne, Fort Worth, Fresno, Greensboro, Henderson, Houston, Indianapol, Jacksonvil, Jersey Cit, Kansas Cit, Laredo, Las Vegas, Lexington, Lincoln, Long Beach, Los Angele, Louisville, Memphis, Mesa, Miami, Milwaukee, Minneapoli, Mobile, Nashville, New Orlean, New York, Newark, Oakland, Oklahoma C, Omaha, Orlando, Philadelph, Phoenix, Pittsburgh, Plano, Portland, Raleigh, Riverside, Sacramento, San Antoni, San Diego, San Franci, San Jose, Santa Ana, Seattle, St. Louis, St. Paul, St. Peters, Stockton, Tampa, Toledo, Tucson, Tulsa, Virginia B, Washington, Wichita; with City in the x-axis and Murder in the y-axis.. The x-axis shows values from 0 to 0. The y-axis shows values from 0 to 0.