Edit chart
Loading graph
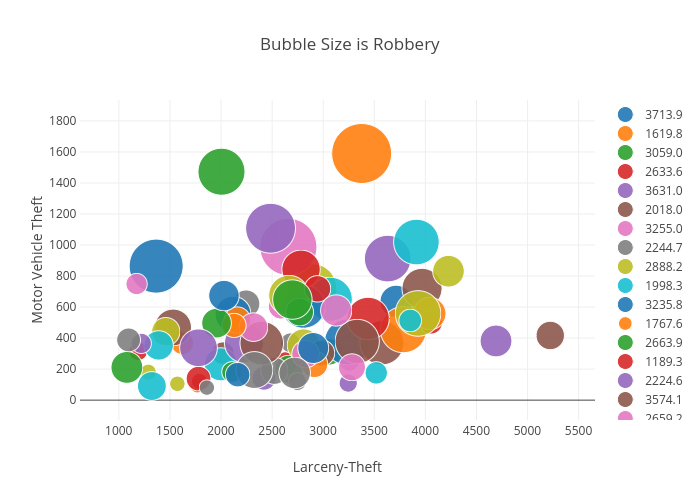
Billatnapier's interactive graph and data of "Bubble Size is Robbery" is a scatter chart, showing 3713.9, 1619.8, 3059.0, 2633.6, 3631.0, 2018.0, 3255.0, 2244.7, 2888.2, 1998.3, 3235.8, 1767.6, 2663.9, 1189.3, 2224.6, 3574.1, 2659.2, 2677.6, 2807.9, 3519.0, 2117.2, 2158.7, 2004.3, 1789.0, 2419.8, 2985.5, 2587.2, 2522.7, 1288.1, 3068.8, 2806.9, 2914.1, 1078.4, 2783.2, 3244.7, 1530.6, 2827.0, 2747.7, 1459.3, 1389.4, 2902.3, 3785.3, 2108.7, 3439.4, 2484.6, 3332.8, 3281.4, 2720.8, 2663.0, 1323.0, 1365.1, 3376.1, 2768.9, 2944.4, 4691.2, 2398.5, 2317.9, 2326.6, 1572.6, 4013.0, 2162.7, 2126.8, 1956.0, 4053.9, 1219.5, 3966.9, 1173.6, 1095.2, 4226.0, 3912.1, 2028.6, 4043.1, 2698.3, 1779.5, 1779.5, 5221.8, 3127.0, 1861.2, 3928.0, 3851.4; with Larceny-Theft in the x-axis and Motor Vehicle Theft in the y-axis.. The x-axis shows values from 0 to 0. The y-axis shows values from 0 to 0.