Edit chart
Loading graph
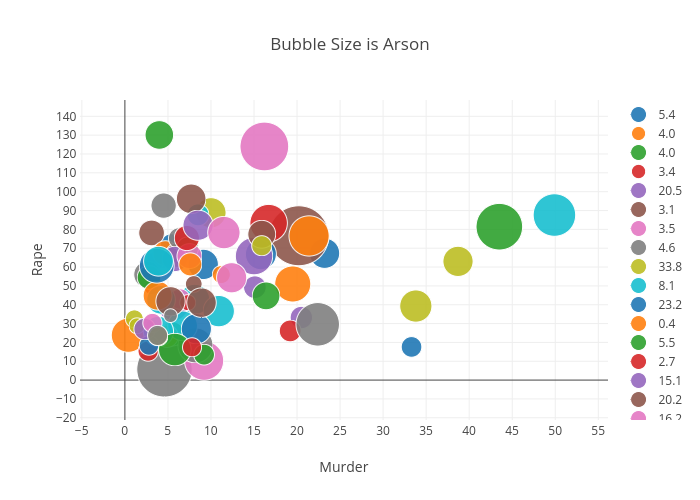
Billatnapier's interactive graph and data of "Bubble Size is Arson" is a scatter chart, showing 5.4, 4.0, 4.0, 3.4, 20.5, 3.1, 3.5, 4.6, 33.8, 8.1, 23.2, 0.4, 5.5, 2.7, 15.1, 20.2, 16.2, 4.5, 10.0, 8.5, 9.1, 4.7, 43.5, 3.1, 4.7, 6.1, 9.2, 8.2, 1.1, 10.9, 15.8, 11.2, 9.2, 16.7, 5.6, 8.0, 6.4, 2.6, 4.9, 6.7, 8.3, 21.4, 2.8, 19.2, 15.0, 7.7, 12.4, 6.3, 38.7, 3.9, 33.3, 19.5, 7.3, 7.3, 5.8, 15.9, 7.5, 22.4, 1.4, 4.2, 2.8, 3.8, 5.8, 7.2, 2.3, 5.3, 3.2, 5.3, 3.9, 49.9, 3.7, 7.6, 16.4, 7.8, 8.5, 8.9, 11.5, 3.8, 15.9, 3.9; with Murder in the x-axis and Rape in the y-axis.. The x-axis shows values from 0 to 0. The y-axis shows values from 0 to 0.