Edit chart
Loading graph
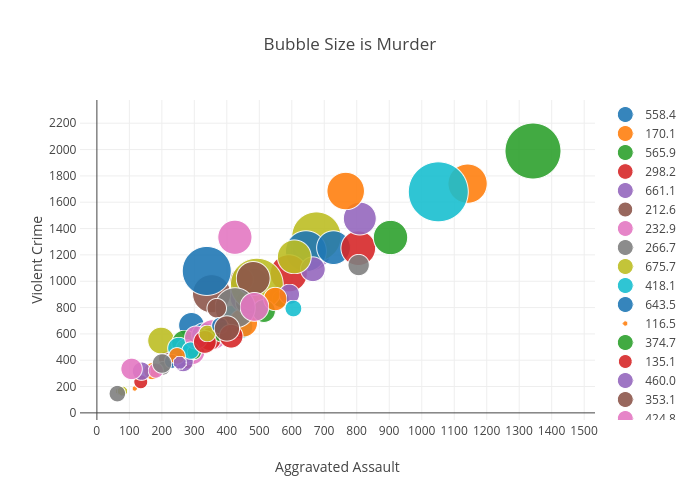
Billatnapier's interactive graph and data of "Bubble Size is Murder" is a scatter chart, showing 558.4, 170.1, 565.9, 298.2, 661.1, 212.6, 232.9, 266.7, 675.7, 418.1, 643.5, 116.5, 374.7, 135.1, 460.0, 353.1, 424.8, 270.4, 197.9, 441.7, 291.1, 362.7, 1342.4, 279.3, 137.3, 328.6, 292.5, 277.8, 71.1, 485.1, 728.4, 450.8, 270.0, 804.6, 265.7, 463.1, 106.8, 204.3, 272.1, 251.8, 329.6, 1141.1, 299.7, 590.5, 809.3, 445.5, 356.3, 805.8, 492.4, 371.3, 338.2, 765.9, 514.1, 347.3, 592.3, 481.1, 305.7, 425.5, 78.8, 288.5, 230.1, 246.7, 385.7, 332.3, 255.2, 368.9, 181.4, 200.6, 339.8, 1050.9, 378.5, 549.1, 903.8, 413.3, 664.8, 400.2, 485.0, 63.0, 607.7, 604.9; with Aggravated Assault in the x-axis and Violent Crime in the y-axis.. The x-axis shows values from 0 to 0. The y-axis shows values from 0 to 0.