Edit chart
Loading graph
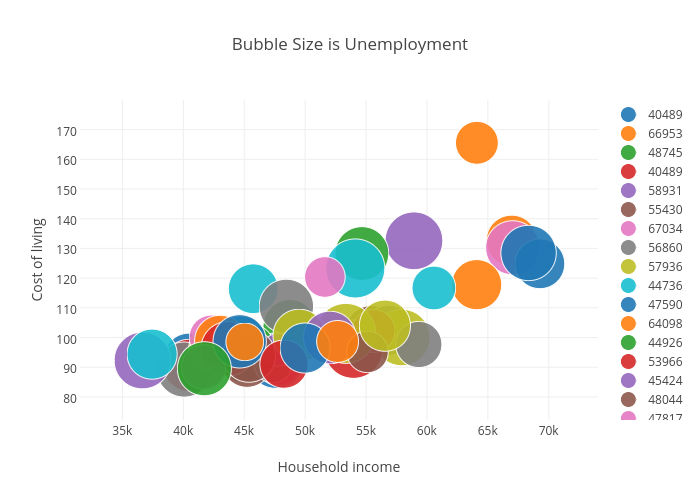
Billatnapier's interactive graph and data of "Bubble Size is Unemployment" is a scatter chart, showing 40489, 66953, 48745, 40489, 58931, 55430, 67034, 56860, 57936, 44736, 47590, 64098, 44926, 53966, 45424, 48044, 47817, 40072, 42492, 45734, 69272, 64081, 45255, 55616, 36646, 45229, 42322, 47357, 53341, 60567, 68342, 43028, 54659, 43674, 47827, 45395, 41664, 48457, 49520, 54119, 44625, 45043, 41725, 48259, 52029, 55117, 51618, 59330, 56548, 37435, 49993, 52664; with Household income in the x-axis and Cost of living in the y-axis.. The x-axis shows values from 0 to 0. The y-axis shows values from 0 to 0.