Edit chart
Loading graph
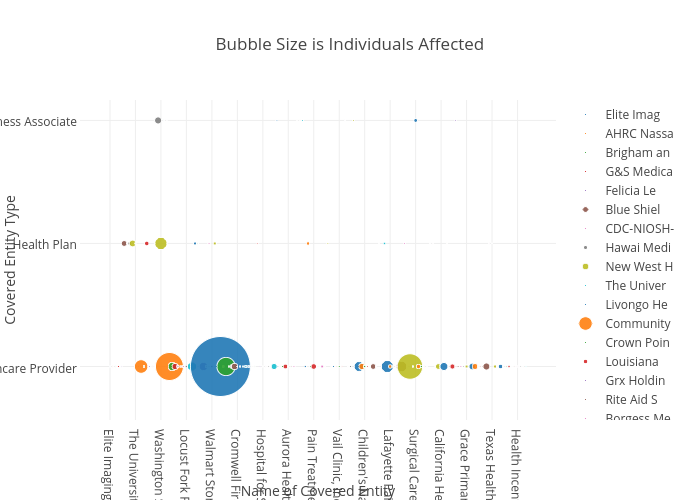
Billatnapier's interactive graph and data of "Bubble Size is Individuals Affected" is a scatter chart, showing Elite Imag, AHRC Nassa, Brigham an, G&S Medica, Felicia Le, Blue Shiel, CDC-NIOSH-, Hawai Medi, New West H, The Univer, Livongo He, Community , Crown Poin, Louisiana , Grx Holdin, Rite Aid S, Borgess Me, SEIM JOHNS, Washington, BlueCross , DataStat, , Radiology , Alliance H, Public Hea, Roark's Ph, ELLIOT J M, BJC Health, Locust For, Vancouver , Valley Hop, Nintendo o, Ecolab Hea, Ecolab Hea, Freeport M, Eye Instit, Mind Sprin, Group Life, Walmart St, Centers Pl, City of Ho, 21st Centu, Cardiology, Premier He, Walgreen C, Complete F, Illinois V, Cromwell F, Vidant Hea, UHHS Geaug, Karmanos C, Virtua Med, Vibrant Bo, JASACare, Laborers F, W. Christo, Hospital f, Lindsay Ho, Val Verde , Bozeman He, National C, Metropolit, Excel Plus, Morton Med, Mercy Iowa, Aurora Hea, Pointe Med, Einstein H, Sisters of, Target Cor, Pacific Ga, RMA Medica, Indian Hea, BioReferen, Pain Treat, Mark Antho, Sacred Hea, OptumRx, I, United Com, American F, Florida De, Oneida Tri, Atique Ort, Vail Clini, Florida Ho, Quarles & , Lake Pulmo, Lake Pulmo, Wyoming Me, Kaiser Fou, Edwin Shaw, Ohio Depar, Mayfield C, Children's, Comanche C, Family & C, Northstar , PruittHeal, Managed He, Florida Me, UnitedHeal, Southeast , Lafayette , UnityPoint, Family Med, Northwest , Medical Co, Employee B, Imperial V, California, Associates, Surgical C, San Juan C, Complete C, Emergency , Tallahasse, Coordinate, Aflac, Keystone R, Integrated, California, Stamford P, Orchid MPS, Washington, ENT and Al, My Pediatr, The Univer, The Vein D, Vincent Ve, Grace Prim, Midland Co, Wal-Mart S, North Otta, PruittHeal, Saints Mar, Riverside , Laser & De, Kern Count, Texas Heal, Allergy, A, Midland Wo, Uncommon C, Ceaton C F, Linda J Wh, Massachuse, Mercy Medi, Heart Cent, Health Inc, Lasair Aes, Cefalu Eye, Blaine Chi; with Name of Covered Entity in the x-axis and Covered Entity Type in the y-axis.. The x-axis shows values from 0 to 0. The y-axis shows values from 0 to 0.