Edit chart
Loading graph
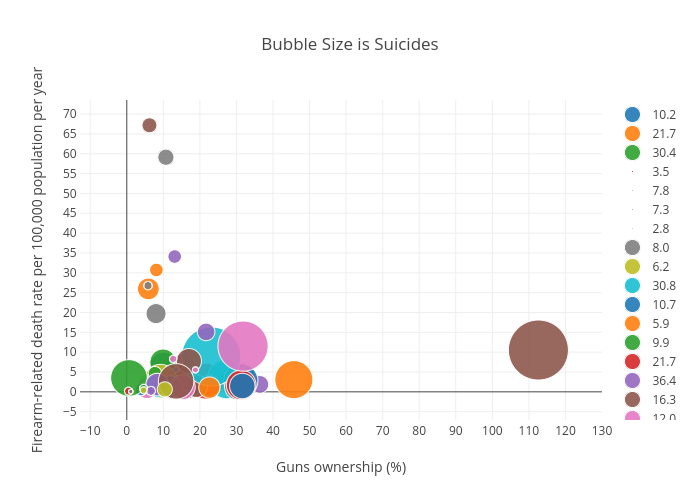
Billatnapier's interactive graph and data of "Bubble Size is Suicides" is a scatter chart, showing 10.2, 21.7, 30.4, 3.5, 7.8, 7.3, 2.8, 8.0, 6.2, 30.8, 10.7, 5.9, 9.9, 21.7, 36.4, 16.3, 12.0, 5.8, 9.2, 27.5, 31.2, 7.3, 30.3, 22.5, 13.1, 6.2, 5.5, 30.3, 4.2, 7.3, 11.9, 8.1, 0.6, 24.8, 0.9, 19.0, 15.3, 15.0, 7.1, 23.1, 3.9, 22.6, 7.7, 31.3, 21.7, 17.0, 18.8, 4.7, 1.3, 8.5, 19.2, 0.7, 0.6, 0.5, 8.3, 13.5, 12.7, 1.1, 10.4, 6.4, 31.6, 45.7, 4.6, 6.6, 6.6, 112.6, 31.8, 10.7, 4.6; with Guns ownership (%) in the x-axis and Firearm-related death rate per 100,000 population per year in the y-axis.. The x-axis shows values from 0 to 0. The y-axis shows values from 0 to 0.