Edit chart
Loading graph
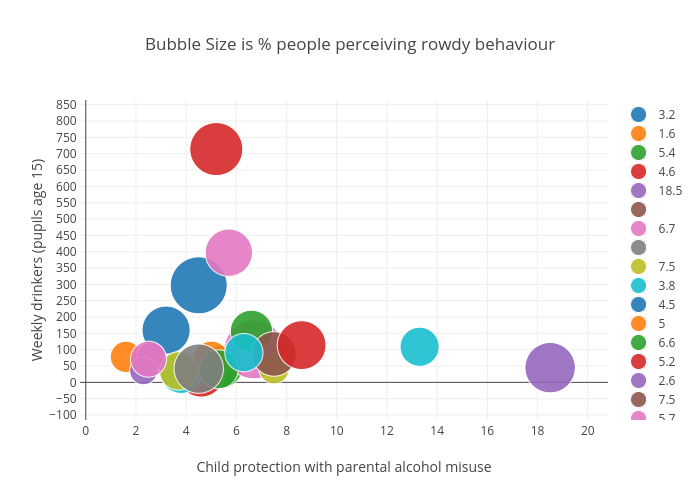
Billatnapier's interactive graph and data of "Bubble Size is % people perceiving rowdy behaviour" is a scatter chart, showing 3.2, 1.6, 5.4, 4.6, 18.5, , 6.7, , 7.5, 3.8, 4.5, 5, 6.6, 5.2, 2.6, 7.5, 5.7, , 3.7, 13.3, , , 5.3, 8.6, 2.3, , 2.5, 4.5, , 6.3; with Child protection with parental alcohol misuse in the x-axis and Weekly drinkers (pupils age 15) in the y-axis.. The x-axis shows values from 0 to 0. The y-axis shows values from 0 to 0.