Edit chart
Loading graph
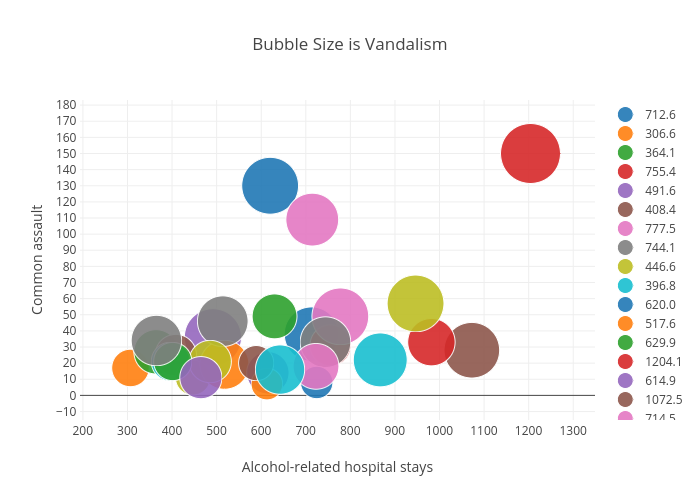
Billatnapier's interactive graph and data of "Bubble Size is Vandalism" is a scatter chart, showing 712.6, 306.6, 364.1, 755.4, 491.6, 408.4, 777.5, 744.1, 446.6, 396.8, 620.0, 517.6, 629.9, 1204.1, 614.9, 1072.5, 714.5, 513.7, 485.5, 867.0, 724.5, 612.7, 401.5, 981.8, 464.6, 588.7, 722.9, 364.9, 946.2, 642.2; with Alcohol-related hospital stays in the x-axis and Common assault in the y-axis.. The x-axis shows values from 0 to 0. The y-axis shows values from 0 to 0.