Edit chart
Loading graph
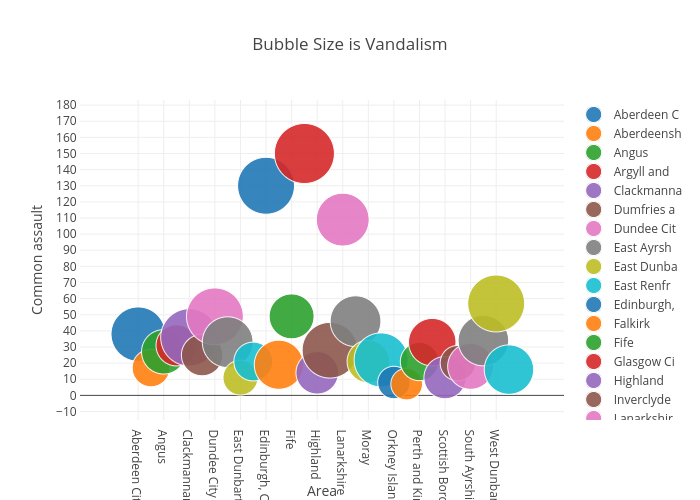
Billatnapier's interactive graph and data of "Bubble Size is Vandalism" is a scatter chart, showing Aberdeen C, Aberdeensh, Angus, Argyll and, Clackmanna, Dumfries a, Dundee Cit, East Ayrsh, East Dunba, East Renfr, Edinburgh,, Falkirk, Fife, Glasgow Ci, Highland, Inverclyde, Lanarkshir, Mid and Ea, Moray, North Ayrs, Orkney Isl, Outer Hebr, Perth and , Renfrewshi, Scottish B, Shetland I, South Ayrs, Stirling, West Dunba, West Lothi; with Area in the x-axis and Common assault in the y-axis.. The x-axis shows values from 0 to 0. The y-axis shows values from 0 to 0.