Edit chart
Loading graph
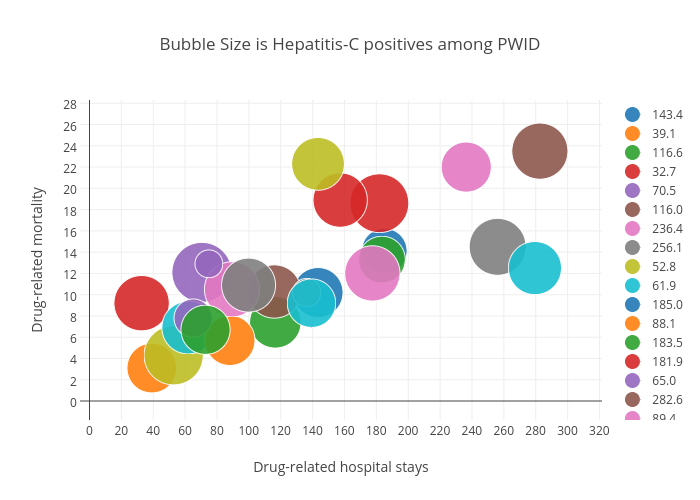
Billatnapier's interactive graph and data of "Bubble Size is Hepatitis-C positives among PWID" is a scatter chart, showing 143.4, 39.1, 116.6, 32.7, 70.5, 116.0, 236.4, 256.1, 52.8, 61.9, 185.0, 88.1, 183.5, 181.9, 65.0, 282.6, 89.4, 136.3, 52.8, 279.5, 67.9, 55.2, 72.8, 157.3, 74.9, 91.3, 177.5, 99.8, 143.4, 139.3; with Drug-related hospital stays in the x-axis and Drug-related mortality in the y-axis.. The x-axis shows values from 0 to 0. The y-axis shows values from 0 to 0.