Edit chart
Loading graph
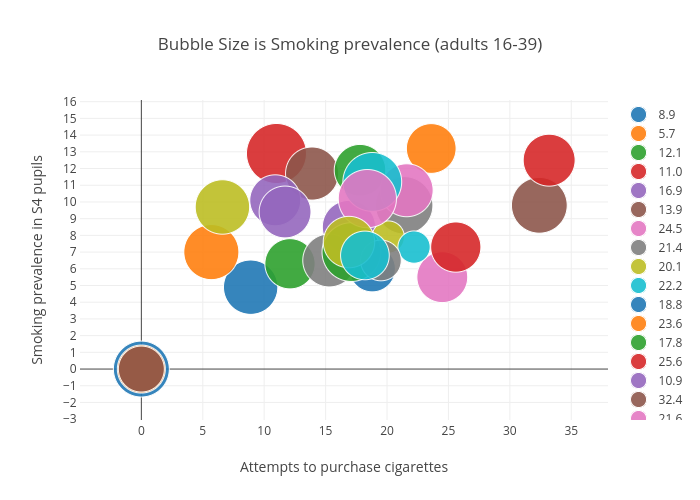
Billatnapier's interactive graph and data of "Bubble Size is Smoking prevalence (adults 16-39)" is a scatter chart, showing 8.9, 5.7, 12.1, 11.0, 16.9, 13.9, 24.5, 21.4, 20.1, 22.2, 18.8, 23.6, 17.8, 25.6, 10.9, 32.4, 21.6, 15.3, 6.6, 18.8, 0.0, 0.0, 17.1, 33.2, 11.7, 0.0, 18.4, 19.5, 16.9, 18.2; with Attempts to purchase cigarettes in the x-axis and Smoking prevalence in S4 pupils in the y-axis.. The x-axis shows values from 0 to 0. The y-axis shows values from 0 to 0.