Edit chart
Loading graph
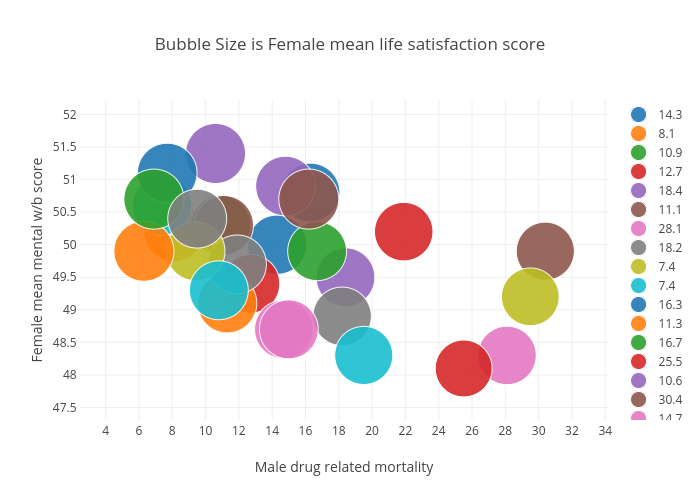
Billatnapier's interactive graph and data of "Bubble Size is Female mean life satisfaction score" is a scatter chart, showing 14.3, 8.1, 10.9, 12.7, 18.4, 11.1, 28.1, 18.2, 7.4, 7.4, 16.3, 11.3, 16.7, 25.5, 10.6, 30.4, 14.7, 11.9, 9.4, 19.5, 7.7, 6.3, 6.9, 21.9, 14.8, 16.2, 15.0, 9.5, 29.5, 10.8; with Male drug related mortality in the x-axis and Female mean mental w/b score in the y-axis.. The x-axis shows values from 0 to 0. The y-axis shows values from 0 to 0.