Edit chart
Loading graph
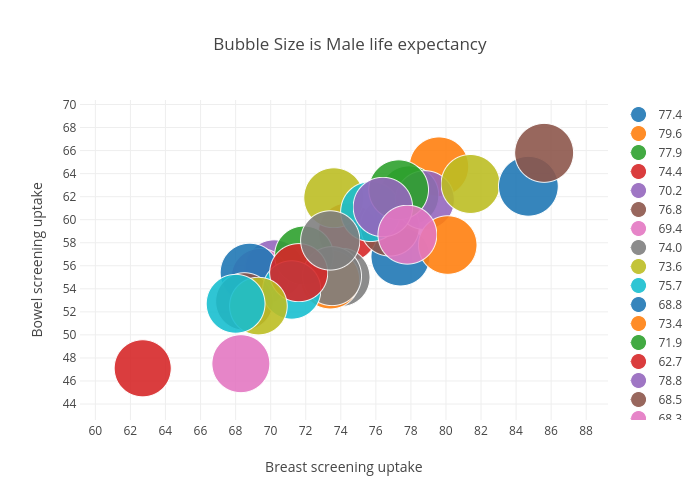
Billatnapier's interactive graph and data of "Bubble Size is Male life expectancy" is a scatter chart, showing 77.4, 79.6, 77.9, 74.4, 70.2, 76.8, 69.4, 74.0, 73.6, 75.7, 68.8, 73.4, 71.9, 62.7, 78.8, 68.5, 68.3, 73.5, 81.4, 71.2, 84.7, 80.1, 77.3, 71.6, 76.4, 85.6, 77.8, 73.4, 69.3, 68.0; with Breast screening uptake in the x-axis and Bowel screening uptake in the y-axis.. The x-axis shows values from 0 to 0. The y-axis shows values from 0 to 0.