Edit chart
Loading graph
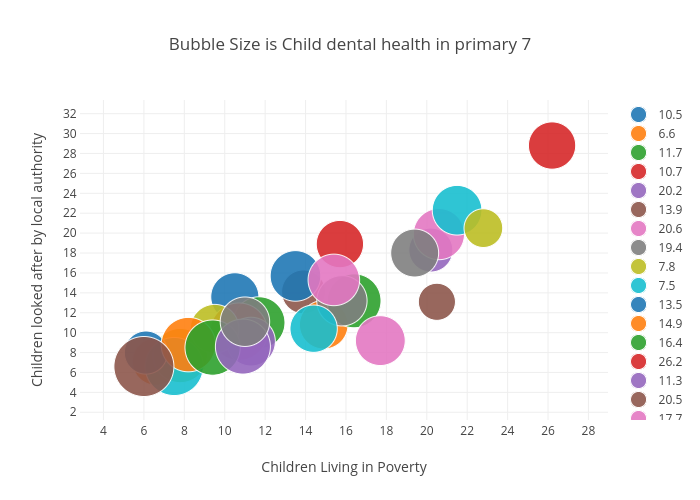
Billatnapier's interactive graph and data of "Bubble Size is Child dental health in primary 7" is a scatter chart, showing 10.5, 6.6, 11.7, 10.7, 20.2, 13.9, 20.6, 19.4, 7.8, 7.5, 13.5, 14.9, 16.4, 26.2, 11.3, 20.5, 17.7, 15.8, 9.5, 21.5, 6.1, 8.2, 9.4, 15.7, 10.9, 6.0, 15.4, 11.0, 22.8, 14.4; with Children Living in Poverty in the x-axis and Children looked after by local authority in the y-axis.. The x-axis shows values from 0 to 0. The y-axis shows values from 0 to 0.