Edit chart
Loading graph
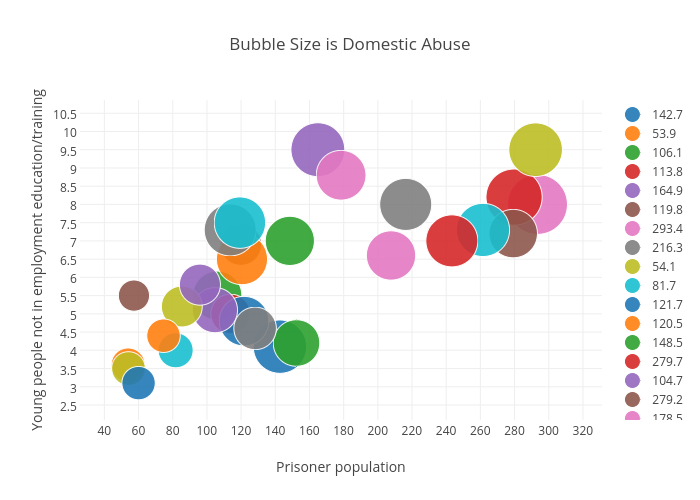
Billatnapier's interactive graph and data of "Bubble Size is Domestic Abuse" is a scatter chart, showing 142.7, 53.9, 106.1, 113.8, 164.9, 119.8, 293.4, 216.3, 54.1, 81.7, 121.7, 120.5, 148.5, 279.7, 104.7, 279.2, 178.5, 113.6, 85.3, 261.5, 60.0, 74.6, 152.4, 243.3, 95.9, 57.3, 207.7, 128.2, 292.3, 119.3; with Prisoner population in the x-axis and Young people not in employment education/training in the y-axis.. The x-axis shows values from 0 to 0. The y-axis shows values from 0 to 0.