Edit chart
Loading graph
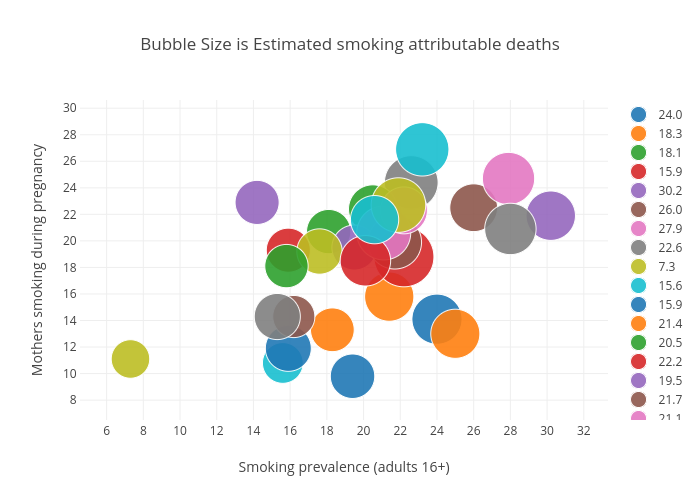
Billatnapier's interactive graph and data of "Bubble Size is Estimated smoking attributable deaths" is a scatter chart, showing 24.0, 18.3, 18.1, 15.9, 30.2, 26.0, 27.9, 22.6, 7.3, 15.6, 15.9, 21.4, 20.5, 22.2, 19.5, 21.7, 21.1, 28.0, 17.6, 23.2, 19.4, 25.0, 15.8, 20.1, 14.2, 16.2, 22.2, 15.3, 21.9, 20.6; with Smoking prevalence (adults 16+) in the x-axis and Mothers smoking during pregnancy in the y-axis.. The x-axis shows values from 0 to 0. The y-axis shows values from 0 to 0.