Edit chart
Loading graph
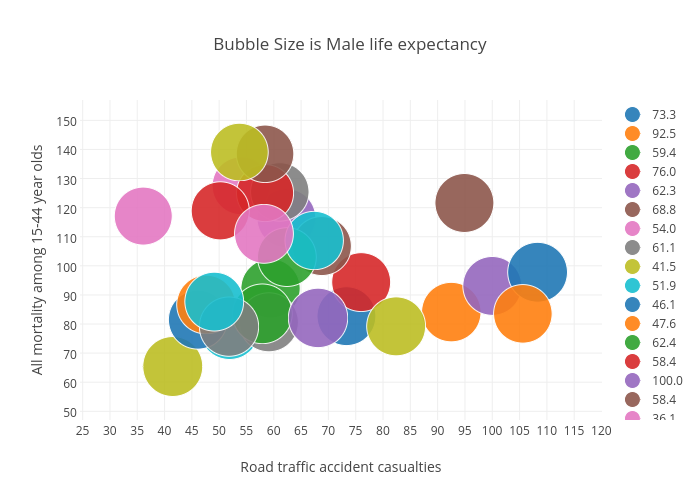
Billatnapier's interactive graph and data of "Bubble Size is Male life expectancy" is a scatter chart, showing 73.3, 92.5, 59.4, 76.0, 62.3, 68.8, 54.0, 61.1, 41.5, 51.9, 46.1, 47.6, 62.4, 58.4, 100.0, 58.4, 36.1, 59.1, 82.4, 67.4, 108.3, 105.6, 57.9, 50.2, 68.1, 94.9, 58.2, 51.8, 53.7, 49.1; with Road traffic accident casualties in the x-axis and All mortality among 15-44 year olds in the y-axis.. The x-axis shows values from 0 to 0. The y-axis shows values from 0 to 0.