Edit chart
Loading graph
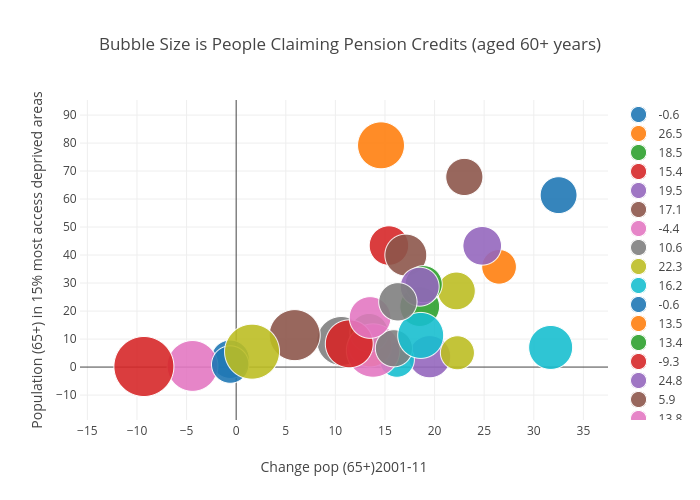
Billatnapier's interactive graph and data of "Bubble Size is People Claiming Pension Credits (aged 60+ years)" is a scatter chart, showing -0.6, 26.5, 18.5, 15.4, 19.5, 17.1, -4.4, 10.6, 22.3, 16.2, -0.6, 13.5, 13.4, -9.3, 24.8, 5.9, 13.8, 15.9, 22.2, 18.6, 32.5, 14.6, 18.9, 11.4, 18.5, 23.0, 13.5, 16.3, 1.6, 31.7; with Change pop (65+)2001-11 in the x-axis and Population (65+) in 15% most access deprived areas in the y-axis.. The x-axis shows values from 0 to 0. The y-axis shows values from 0 to 0.