Edit chart
Loading graph
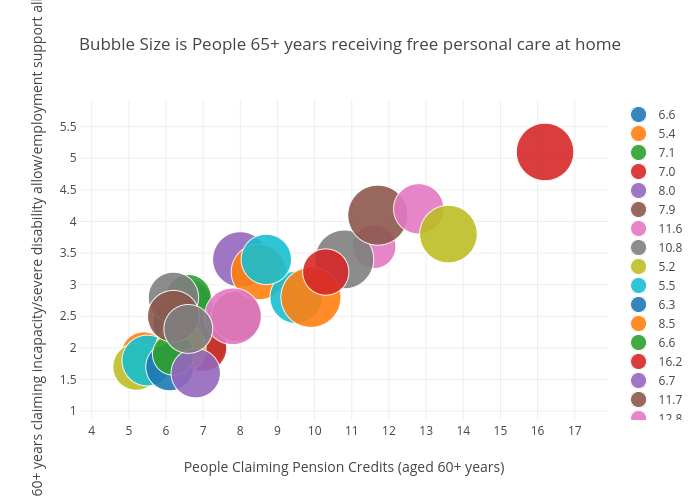
Billatnapier's interactive graph and data of "Bubble Size is People 65+ years receiving free personal care at home" is a scatter chart, showing 6.6, 5.4, 7.1, 7.0, 8.0, 7.9, 11.6, 10.8, 5.2, 5.5, 6.3, 8.5, 6.6, 16.2, 6.7, 11.7, 12.8, 6.2, 6.4, 9.5, 6.1, 9.9, 6.2, 10.3, 6.8, 6.2, 7.8, 6.6, 13.6, 8.7; with People Claiming Pension Credits (aged 60+ years) in the x-axis and Adults 60+ years claiming incapacity/severe disability allow/employment support allow in the y-axis.. The x-axis shows values from 0 to 0. The y-axis shows values from 0 to 0.