Edit chart
Loading graph
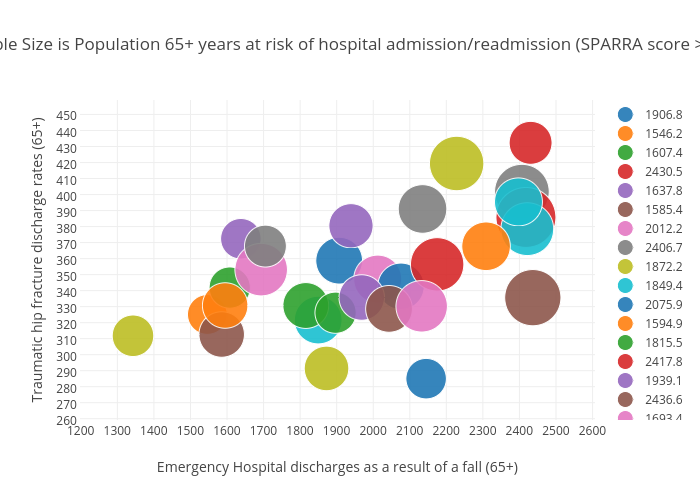
Billatnapier's interactive graph and data of "Bubble Size is Population 65+ years at risk of hospital admission/readmission (SPARRA score >=40)" is a scatter chart, showing 1906.8, 1546.2, 1607.4, 2430.5, 1637.8, 1585.4, 2012.2, 2406.7, 1872.2, 1849.4, 2075.9, 1594.9, 1815.5, 2417.8, 1939.1, 2436.6, 1693.4, 2134.9, 1342.7, 2421.4, 2144.7, 2308.7, 1896.9, 2174.9, 1968.5, 2043.2, 2132.5, 1705.0, 2228.2, 2397.3; with Emergency Hospital discharges as a result of a fall (65+) in the x-axis and Traumatic hip fracture discharge rates (65+) in the y-axis.. The x-axis shows values from 0 to 0. The y-axis shows values from 0 to 0.