Edit chart
Loading graph
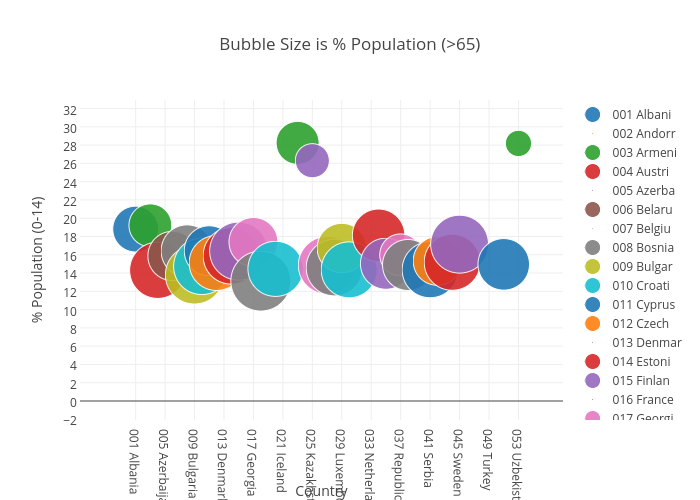
Billatnapier's interactive graph and data of "Bubble Size is % Population (>65)" is a scatter chart, showing 001 Albani, 002 Andorr, 003 Armeni, 004 Austri, 005 Azerba, 006 Belaru, 007 Belgiu, 008 Bosnia, 009 Bulgar, 010 Croati, 011 Cyprus, 012 Czech , 013 Denmar, 014 Estoni, 015 Finlan, 016 France, 017 Georgi, 018 German, 019 Greece, 020 Hungar, 021 Icelan, 022 Irelan, 023 Israel, 024 Italy, 025 Kazakh, 026 Kyrgyz, 027 Latvia, 028 Lithua, 029 Luxemb, 030 Malta, 031 Monaco, 032 Monten, 033 Nether, 034 Norway, 035 Poland, 036 Portug, 037 Republ, 038 Romani, 039 Russia, 040 San Ma, 041 Serbia, 042 Slovak, 043 Sloven, 044 Spain, 045 Sweden, 046 Switze, 047 Tajiki, 048 MKD*, 049 Turkey, 050 Turkme, 051 Ukrain, 052 United, 053 Uzbeki; with Country in the x-axis and % Population (0-14) in the y-axis.. The x-axis shows values from 0 to 0. The y-axis shows values from 0 to 0.