Edit chart
Loading graph
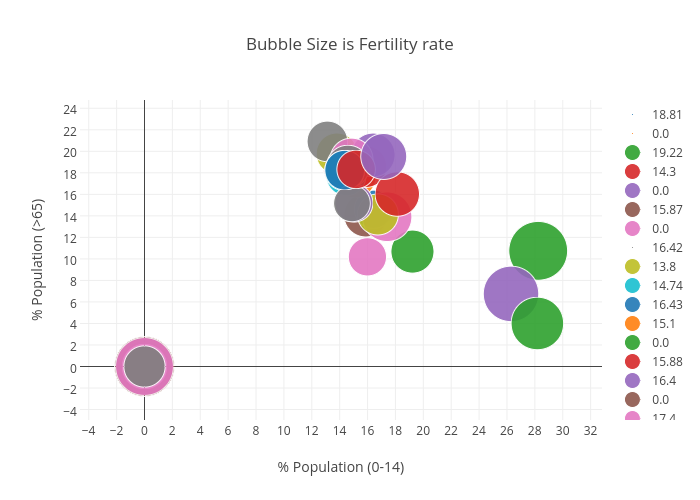
Billatnapier's interactive graph and data of "Bubble Size is Fertility rate" is a scatter chart, showing 18.81, 0.0, 19.22, 14.3, 0.0, 15.87, 0.0, 16.42, 13.8, 14.74, 16.43, 15.1, 0.0, 15.88, 16.4, 0.0, 17.4, 13.12, 0.0, 14.46, 0.0, 0.0, 28.24, 0.0, 26.29, 0.0, 14.85, 14.59, 16.74, 14.35, 0.0, 0.0, 0.0, 18.13, 15.02, 0.0, 15.99, 14.88, 0.0, 0.0, 14.36, 15.32, 0.0, 15.18, 17.16, 0.0, 0.0, 0.0, 0.0, 0.0, 14.95, 0.0, 28.18; with % Population (0-14) in the x-axis and % Population (>65) in the y-axis.. The x-axis shows values from 0 to 0. The y-axis shows values from 0 to 0.