Edit chart
Loading graph
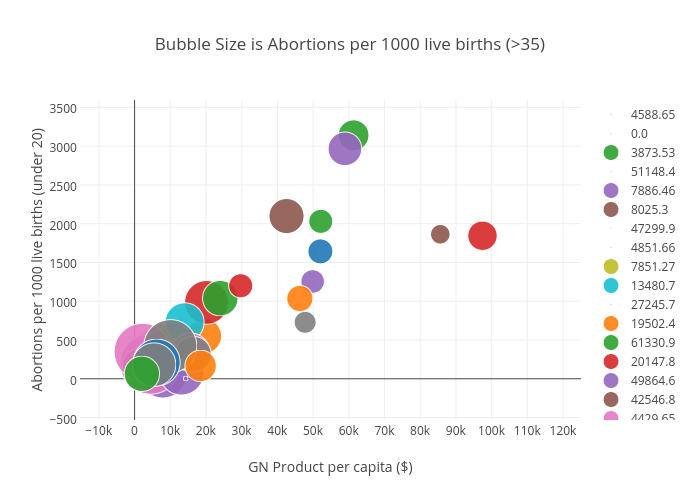
Billatnapier's interactive graph and data of "Bubble Size is Abortions per 1000 live births (>35)" is a scatter chart, showing 4588.65, 0.0, 3873.53, 51148.4, 7886.46, 8025.3, 47299.9, 4851.66, 7851.27, 13480.7, 27245.7, 19502.4, 61330.9, 20147.8, 49864.6, 42546.8, 4429.65, 47767.0, 21627.4, 14021.9, 52036.7, 54321.3, 37206.2, 35179.7, 13154.8, 1279.77, 15692.2, 16489.7, 116612.9, 0.0, 0.0, 7378.04, 52138.7, 97429.7, 14337.2, 22124.4, 2244.76, 10011.8, 13902.1, 0.0, 6200.17, 18501.4, 24001.9, 29718.5, 58900.0, 85610.8, 1113.37, 5453.28, 10303.9, 8193.72, 3065.16, 46278.5, 2052.59; with GN Product per capita ($) in the x-axis and Abortions per 1000 live births (under 20) in the y-axis.. The x-axis shows values from 0 to 0. The y-axis shows values from 0 to 0.