Edit chart
Loading graph
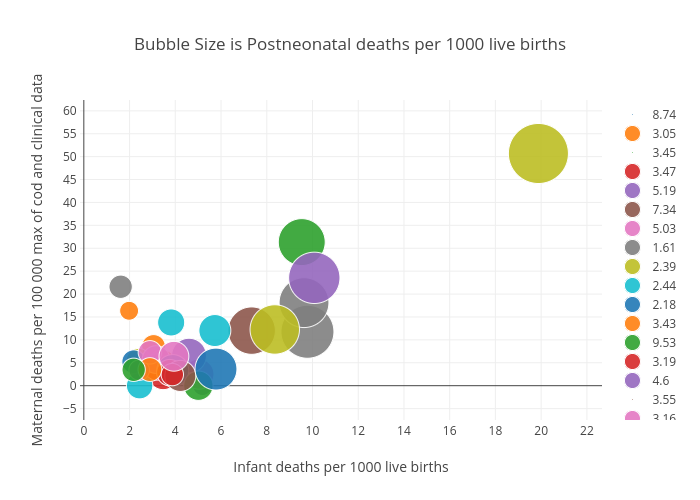
Billatnapier's interactive graph and data of "Bubble Size is Postneonatal deaths per 1000 live births" is a scatter chart, showing 8.74, 3.05, 3.45, 3.47, 5.19, 7.34, 5.03, 1.61, 2.39, 2.44, 2.18, 3.43, 9.53, 3.19, 4.6, 3.55, 3.16, 9.78, 19.88, 3.82, 3.89, 1.98, 5.01, 3.76, 2.42, 4.22, 2.89, 9.63, 8.35, 5.73, 5.78, 2.89, 2.18, 3.87, 10.08, 7.85, 3.94, 10.71; with Infant deaths per 1000 live births in the x-axis and Maternal deaths per 100 000 max of cod and clinical data in the y-axis.. The x-axis shows values from 0 to 0. The y-axis shows values from 0 to 0.