Edit chart
Loading graph
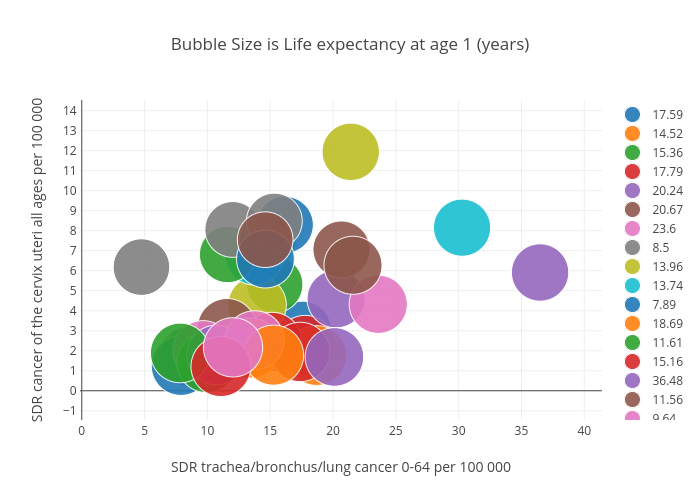
Billatnapier's interactive graph and data of "Bubble Size is Life expectancy at age 1 (years)" is a scatter chart, showing 17.59, 14.52, 15.36, 17.79, 20.24, 20.67, 23.6, 8.5, 13.96, 13.74, 7.89, 18.69, 11.61, 15.16, 36.48, 11.56, 9.64, 12.02, 8.62, 14.82, 16.17, 13.49, 9.95, 17.38, 10.73, 21.59, 13.76, 15.33, 21.41, 30.27, 14.62, 15.27, 7.84, 11.08, 20.11, 14.6, 12.04, 4.75; with SDR trachea/bronchus/lung cancer 0-64 per 100 000 in the x-axis and SDR cancer of the cervix uteri all ages per 100 000 in the y-axis.. The x-axis shows values from 0 to 0. The y-axis shows values from 0 to 0.